OUR PRODUCTS
Uberr Clone AppGojek Clone AppSuper App DevelopmentUberr Eats Clone AppGrocery App DevelopmentHandyman App Like Uberr
inDriver Clone AppDelivery App DevelopmentGlovo Clone AppBolt Clone AppLyft Clone AppCareem Clone App
OUR PRODUCTS

← Back to Blog
August 6, 2026
A practical guide to measuring customer acquisition cost, restaurant commission, delivery expense, contribution margin, and payback for food delivery platforms.
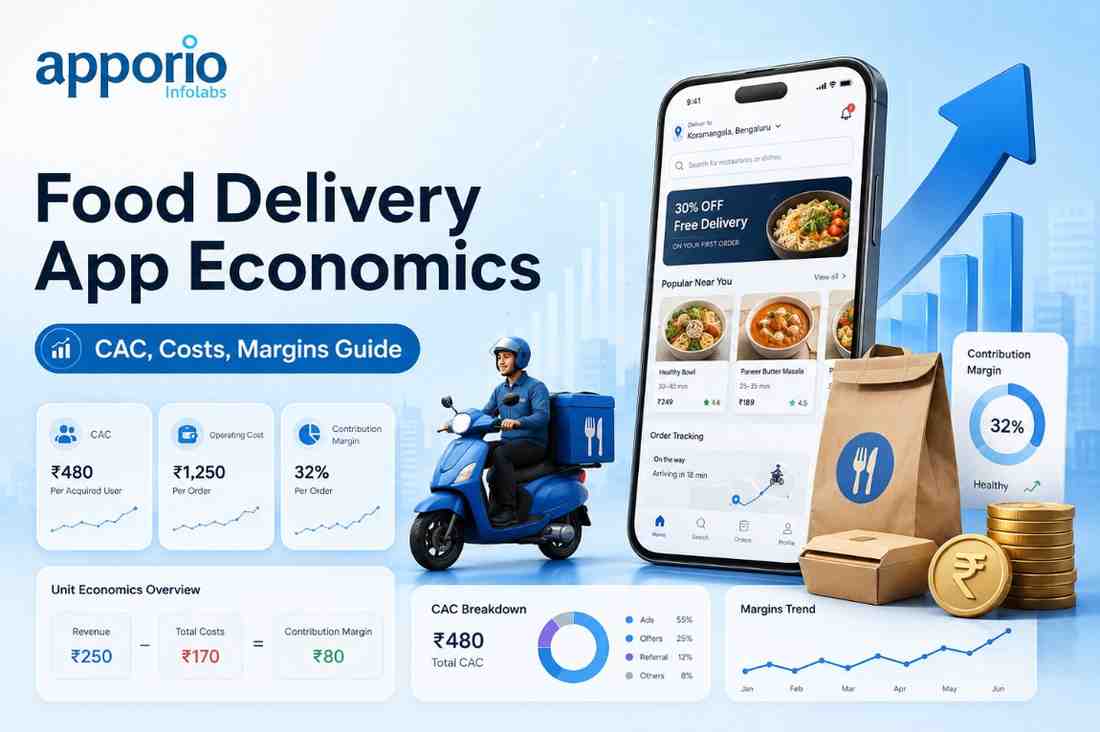
A food delivery platform can process a large number of orders and still lose money on every transaction. The reason is simple: gross order value is not the same as revenue, and revenue is not the same as contribution profit. Founders need to understand food delivery app unit economics before investing heavily in promotions, driver supply, or market expansion.
The basic question is: after collecting customer fees, restaurant commissions, and other order revenue, how much remains after discounts, payment processing, delivery payouts, customer support, refunds, and acquisition costs? The answer should be measured per completed order and per acquired customer.
This guide explains the main cost lines, provides an illustrative calculation, and shows how product decisions affect margin. The figures used below are examples for planning only. Actual results vary by country, order value, labor model, delivery distance, tax structure, payment provider, and competitive conditions.
Unit economics is the financial performance of one measurable business unit. For a delivery marketplace, that unit is usually a completed order. Some operators also track a customer cohort, such as all users acquired during a particular month, because the first order may be unprofitable while later orders generate positive contribution.
A useful order-level formula is:
Contribution margin per order = order revenue − variable order costs
Order revenue can include restaurant commission, customer delivery fees, service fees, small-order fees, subscription allocation, advertising revenue, and other transaction-linked income. Variable costs can include delivery partner payout, discounts funded by the platform, payment processing, refunds, support cost, fraud losses, and order-level incentives.
Customer acquisition cost is tracked separately when calculating payback:
CAC = total sales and marketing spend ÷ number of newly acquired customers
If a platform spends $10,000 and acquires 500 first-time customers, its blended CAC is $20. That figure only becomes useful when compared with contribution generated by those customers over a defined period.
Gross margin may subtract only direct fulfillment or platform costs. Contribution margin goes further by including the variable costs that change with each order. For a marketplace, this distinction matters because a commission percentage may look attractive until delivery subsidies and discounts are included.
Fixed costs such as product development, management salaries, office expenses, and long-term brand campaigns are important for company profitability, but they should not be mixed into the first order-level calculation. Track fixed overhead separately, then determine how many positive-contribution orders are needed to cover it.
Unit economics gives a founder a decision framework before a market is fully developed. It helps answer whether the business should focus on higher-value restaurants, shorter delivery zones, subscriptions, corporate orders, or a narrower launch area.
Without this view, teams often optimize the wrong metric. Order volume can rise because of deep discounts while contribution losses widen. Downloads can increase while activation remains weak. Restaurant sign-ups can look strong while low basket sizes make delivery unprofitable.
Several operating decisions depend on the same financial model:
These calculations also improve conversations with investors and operating partners. Instead of presenting only projected order volume, the team can explain assumptions, sensitivities, and the point at which a customer cohort is expected to recover acquisition spend.
A detailed financial model is not only an accounting exercise. It connects pricing, dispatch, restaurant operations, product design, and marketing into one operating view. That makes it easier to identify the specific variables that need attention.
Customer delivery fees should reflect distance, delivery time, market competition, and the cost of maintaining supply. A flat fee may be easy to understand but can produce losses on long routes. Distance-based or zone-based pricing can make the relationship between fulfillment cost and customer payment clearer.
Tracking funded discounts by cohort shows whether an offer creates repeat customers or only subsidizes one transaction. A promotion may be reasonable for first-order acquisition if later contribution covers the initial loss, but that assumption must be tested instead of treated as fact.
Delivery cost is influenced by route length, waiting time, batching, failed handoffs, peak-hour incentives, and driver utilization. Order-level reporting can reveal whether the main issue is low density, excessive restaurant preparation time, or weak dispatch coordination.
Not every restaurant produces the same economics. High-value orders may absorb delivery costs better than small baskets. Reliable preparation times can reduce courier waiting. Operators can use these patterns to design commission tiers, minimum basket rules, or targeted merchant support.
Repeat ordering reduces the need to pay CAC again for every transaction. Cohort analysis can show the number of orders required for a customer to reach payback and which retention behaviors are associated with stronger contribution.
Build the model in a spreadsheet or analytics dashboard before launch, then replace assumptions with actual transaction data. Keep revenue and cost lines separate so that a change in one assumption does not hide another problem.
Assume a customer places a $30 food order. The platform receives a 20% restaurant commission, or $6. It also retains a $3 customer delivery and service fee. The platform funds a $4 discount. Delivery payout is $5, payment processing is $1, and order-level support and refund provision total $0.50.
In this example, platform revenue is $9. Variable costs are $10.50, producing a contribution loss of $1.50 before customer acquisition cost. If the customer was acquired through a campaign costing $12 per new customer, the first-order deficit is $13.50. Repeat orders, subscription revenue, better basket size, lower delivery cost, or stronger commission revenue would need to close that gap.
The calculation is intentionally simple. A production model should also account for taxes, chargebacks, failed deliveries, merchant credits, currency movement, and differences between promised and actual delivery payouts.
The strongest improvements usually come from several small changes rather than one aggressive commission increase. Every change should be tested against customer conversion, restaurant retention, courier supply, and repeat ordering.
Report economics by delivery area, daypart, weekday, and order size. A city-wide average can hide profitable dense zones and loss-making outer zones. Peak periods may increase demand but also require higher courier incentives and create restaurant delays.
Minimum order values, add-on recommendations, bundles, and free-delivery thresholds can raise revenue per trip. The target is not simply a larger basket; it is a larger contribution after any additional discount or fulfillment cost.
Use route distance, estimated time, demand, and courier availability to guide fees. If the platform promises free delivery, identify the funding source in the model. A customer fee can be waived as a marketing expense, but the cost should remain visible.
Courier waiting time creates a direct cost and reduces delivery capacity. The platform should monitor preparation estimates, handoff delays, order accuracy, and cancellations. Better merchant workflows may improve economics without changing commission rates.
Paid acquisition, referral credits, reactivation campaigns, and loyalty incentives should not be placed in one unexamined marketing total. Each has a different purpose and should be compared with the behavior it is intended to create.
Payment methods, settlement cycles, local currencies, and refund practices differ across regions. A delivery platform may need more than cards, so the checkout and finance design should support the payment methods customers actually use. Apporio’s payment gateways page is relevant when reviewing this part of the product scope.
Track the complete order lifecycle: browse, cart creation, checkout, payment authorization, restaurant acceptance, preparation, courier assignment, pickup, delivery, cancellation, refund, and rating. Without event-level data, finance teams cannot reliably explain why an order became unprofitable.
A dedicated delivery app development plan should therefore include customer, restaurant, courier, admin, payment, and reporting workflows rather than treating the customer application as the whole product.
Many early financial models are not wrong because of arithmetic. They are wrong because important costs are omitted or assigned to the wrong period. Correcting these issues can materially change the launch plan.
Fraud and account abuse also deserve attention. Multiple accounts, promotional exploitation, fake refunds, and payment disputes can turn an apparently positive cohort negative. Security controls and review processes should be connected to financial reporting, not handled as an unrelated technical concern.
The following comparison shows what each lever changes and the trade-off that operators should monitor. No single lever can compensate for every structural problem.
| Lever | Potential economic effect | Key risk to monitor | Useful measure |
|---|---|---|---|
| Restaurant commission | Raises platform revenue per order | Merchant churn, menu price inflation, reduced supply | Contribution by merchant segment |
| Customer delivery fee | Offsets courier and route expense | Lower checkout conversion or smaller order frequency | Fee acceptance and completed-order rate |
| Platform-funded discount | May improve acquisition or repeat use | Higher loss per order and promotion dependency | Incremental orders and cohort payback |
| Minimum order value | Improves basket economics and trip efficiency | Lost conversions for small households or low-income users | Average basket and conversion rate |
| Delivery batching | Can reduce cost per delivered order | Longer delivery times and food quality concerns | Cost per order and on-time rate |
| Subscription plan | Creates recurring revenue and may increase order frequency | Fee waivers exceeding subscription revenue | Subscriber contribution over time |
Review these levers together. For example, reducing a delivery fee may improve conversion, but the decision is sound only if the resulting incremental orders and customer retention offset the added subsidy. Similarly, batching may lower delivery cost while damaging repeat usage if arrival times become unreliable.
Healthy marketplace economics come from measuring the complete transaction, not from focusing on commission or order volume in isolation. Track platform revenue, discounts, delivery payout, payment costs, refunds, support, CAC, repeat orders, and cohort payback by market and operating segment.
For a new operator, the practical path is to launch with clear assumptions, instrument every order stage, review contribution weekly, and adjust pricing or delivery operations based on observed behavior. Apporio can support this planning through Ubereats Clone, Food Delivery, on-demand app development, and payment integration planning. These products and services can provide a starting point for defining the customer, restaurant, courier, and admin workflows that the financial model depends on.
Before committing to a market, test the assumptions behind food delivery app unit economics with local delivery costs, merchant terms, payment fees, promotion budgets, and realistic repeat behavior. Book Free Demo
It is the financial performance of a measurable unit, usually one completed order or one customer cohort. It compares retained revenue with variable costs such as discounts, delivery payouts, payment fees, refunds, support, and acquisition spending.
CAC is calculated by dividing attributable sales and marketing spend by the number of newly acquired customers in the same period. Installs and clicks should not be counted as customers unless they complete the defined acquisition event.
Include platform-funded discounts, courier or fleet payouts, peak incentives, payment processing, chargebacks, refunds, fraud losses, and order-specific support. Keep fixed overhead separate from variable order contribution.
It can improve basket size, set delivery fees based on actual route cost, reduce courier waiting, manage promotions by cohort, improve delivery density, review restaurant terms, and monitor profitability by zone and time.
No. Gross order value includes money collected for the restaurant and may also include taxes collected for authorities. Platform revenue should reflect commissions, retained customer fees, advertising allocation, subscription allocation, and other amounts the platform actually keeps.
Repeat customers can remain unprofitable when they use large discounts, generate small baskets, require costly long-distance delivery, or create frequent refunds. Cohort analysis should compare cumulative contribution with CAC rather than assuming repeat activity is automatically profitable.

